
Keeping the NDIS on track
But the most recent Quarterly Report released last week features a brand new report card on the NDIS. And it makes for some interesting reading.
But first a bit of background. Back during the Federal election last year (goodness that feels like a long time ago now doesn’t it?) the Coalition promised to introduce something they called the Participant Service Guarantee.
The PSG as it is now called (because we all know the NDIS needs another acronym) basically sets out timeframes for key NDIS processes – such as deciding whether someone is eligible for the NDIS and how long they have to wait for their first NDIS plan and budget. It also sets out how long people should have to wait for things like reviews to be sorted out.
The legislation introducing the PSG was supposed to hit Parliament this year. But COVID19 got in the way of that. But in a really good move the NDIA have decided to start reporting against the timeframes anyway – even without the legislation.
And while we are often critical of the NDIA, we think this was a good thing. It allows the NDIA to be much more transparent about how long things are actually taking – and where effort and attention need to turn next.
And alongside the PSG, the NDIA also introduced something called the Participant Service Charter and the Service Improvement Plan (or SIP for short). And while they are mouthfuls, both are good things. The Charter outlines the way people with disability and their families can expect the NDIA to behave when it works with them. The SIP outlines all the work the NDIA will do over the next two years to improve people’s experience of the scheme.
So this Quarterly Report not only includes all the usual graphs and data but also how the NDIA are tracking against the PSG, the Charter and the SIP. Still with us?
So what did the new report card say about how quickly things are moving now?
Access
The good news first. The report card shows that when it comes to letting people know whether they are eligible for the scheme, the NDIA are getting much quicker. According to the new report card they are making all “access decisions” within 21 days.
First plans
And people are also getting their first plans faster. About 92% of people are getting their first plan within 70 days – compared to about 70% a year ago. And when it comes to kids, about 98% are getting their first plan within 90 days – compared to about 70% a year ago.
Reviews
The NDIA have also made some inroads into the backlog of reviews. According to the new report card, about 74% of all requested reviews are completed within 42 days (compared to only 40% a year ago). And when it comes to reviews of reviewable decisions (RORDs), most are getting sorted out within 90 days – compared to only 60% a year ago.
So while it sounds good, reviews are one area that require a bit more investigation. Unfortunately one of the ways the NDIA might have cut that time down is through something called the “fast pathway”.
We heard about the fast pathway at Senate Estimates last month. Under questioning from Senators, the NDIA admitted that earlier this year they created a new process for reviews. “Simple” reviews got waved through quickly, while the internal review team took a much closer look at more complex cases.
But we don’t know much more than that because the NDIA took most of the Senator’s questions on notice (which is estimates-speak for “we will get back to you”). So we will have to wait for more info on that one.
A quick look on social media will also tell you that some people appear to be getting phone calls asking them to consider switching their review request from a review of a reviewable decision to a change of circumstances review – with a promise that it will be dealt with more quickly. What doesn’t get mentioned is that you then can’t appeal that decision to the AAT.
So stay tuned on the whole issue of reviews.
So that’s the good news. But (you knew there would be a but) there is also bad news in this new report card.
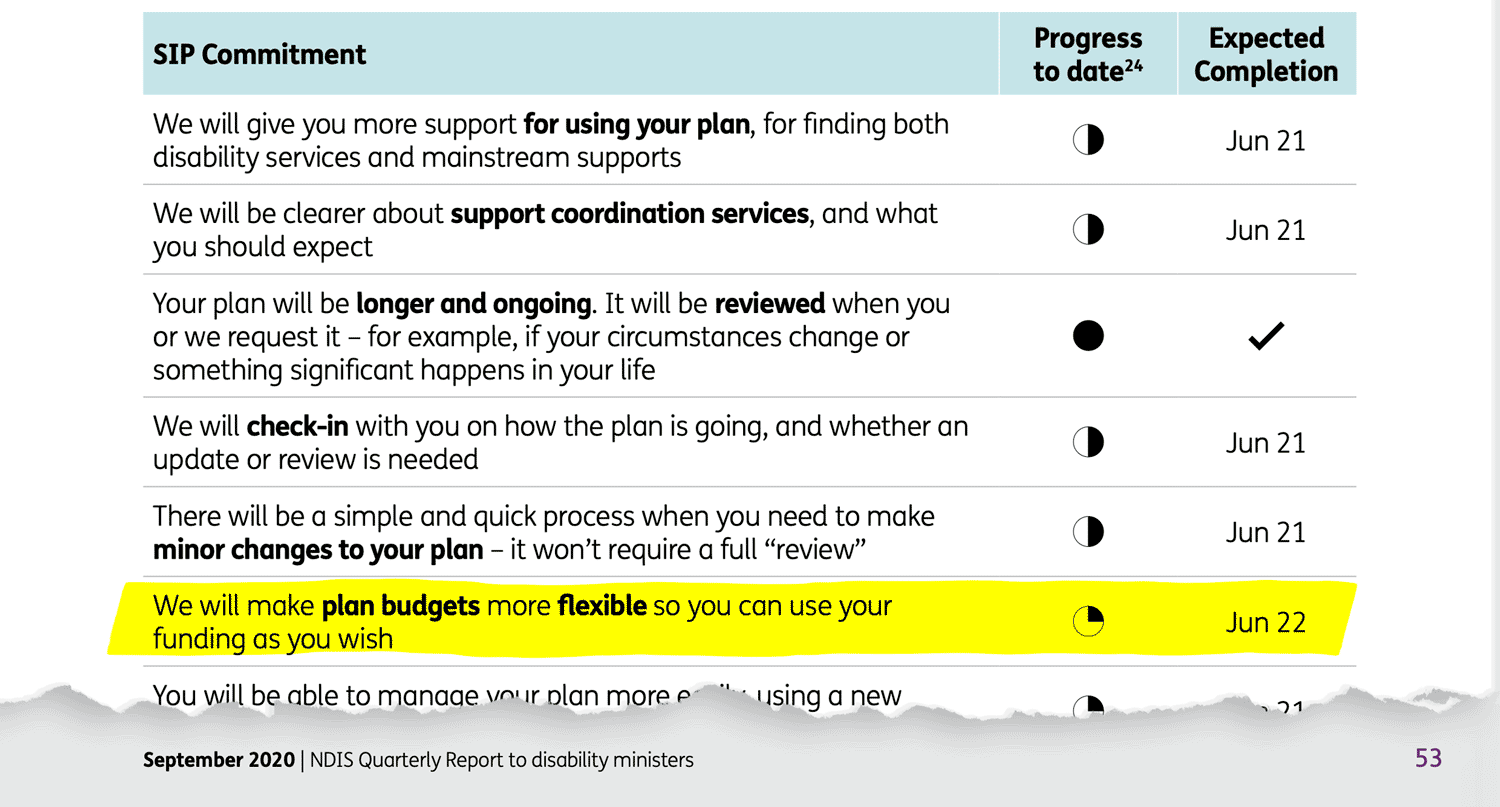
And it is something we have all been holding our collective breath on – greater flexibility in how we use our NDIS funds.
Flexibility
This year the NDIA took a big step and made core funding completely flexible. COVID19 may have helped move things along but it was nevertheless a great move.
And as awesome as that is, it is only a first step. What we hear all the time is that people want much greater flexibility in how they use ALL their funding – particularly the ability to use capacity building more flexibly and to being able to move money between core and capacity building budgets. No more buckets!
We’ve been hearing flexibility is “coming soon” for a good while now. First it was this year. Then it was next year.
But what the new report card shows is that date has now been pushed out to 2022.
Given that we all had our hopes up for next year this is some very bad news.
The new report card gives no more detail than just a date. We have already hit the phones and asked the NDIA for more information – so again stay tuned for more on that one.
What else did we learn?
Apart from the new report card, there was still plenty of info about how other things are travelling.
🧒 Access
People are still steadily coming into the scheme. About 22,000 came in during the last quarter. About 37% of those were kids (0-6 years old).
📈 People from an Aboriginal or Torres Strait Islander background and people from a Culturally or Linguistically Diverse backgrounds
The increased effort to reach out to people from an Aboriginal or Torres Strait Islander background or people from a Culturally or Linguistically Diverse background seems to be paying off a bit. About 9% of people who came into the scheme this quarter identified as Aboriginal or Torres Strait Islander (compared to 6% in previous quarters). About 10% identified as CALD (compared to about 9% in previous quarters) And while the changes are small, it is good to see them heading in the right direction. Small steps after a long time.
📉 Young people in residential aged care
The numbers of young people living in residential aged care fell by a small amount this quarter. There are fewer people going in – and some are actually coming out. Again while the numbers are still small, it is good to see the figures heading in the right direction.
💵 Plan management types
The number of people completely self-managing their plan and budget continues to grow. The number of people who use plan management is also continuing to grow. Over the past few years the number of people who are Agency managed has dropped dramatically – from 70% to 26%.
💰 Scheme sustainability, spending and “independent assessments”
There was a lot – and we mean a lot – about scheme sustainability in this report. According to the NDIA the average plan value has grown from $56,300 to $71,000 over the last three years. That’s an increase of 25%.
When it comes to people who get Supported Independent Living (SIL), the increase over the last few years is even greater. There has been a 35% increase over the last two years.
The NDIA also point out that average plan payments (or the amount people spend) are higher in higher socio-economic areas compared to people who live in lower socio-economic areas. In the highest socioeconomic areas, payments are 23% higher for children and 13% higher for adults.
But this just begs further investigation.
First and most obvious thing. Prices have also increased over the same period – and there is no information in the report about how much of the increase in average plan values is due to increased prices – and how much is due to people getting more support. Big difference and important to know.
And the fact that people in higher socio-economic areas tend to spend more of their NDIS funds is hardly surprising. Those areas are metropolitan – precisely where there are likely to be more services. And more transport options to get to them. You are therefore more likely to find a service that works for you – and as a result, spend more of your NDIS funds.
If you live in a regional area and there are few services in your town – or the nearest service is a long way away – that doesn’t mean you don’t need support. It just means there are not enough suitable services.
The NDIS is also a confusing and complicated beast. People who are better at “navigating” systems are also more likely to spend more of their plans. Again this is not rocket science.
What is interesting is that both of these statistics are used in the report to justify the introduction of so-called “independent assessments”.
And yet … the introduction of these assessments will do nothing to address those two issues.
But what is crystal clear is that these assessments are being introduced to try and stop plans and budgets increasing at the rate they are now.
This fits with what we know from this year’s Federal budget – where for the first time in its history the scheme went over budget. And where the budget papers made very clear that the government intends to keep scheme costs to a certain level both now and into the future.
Scheme sustainability is important to everyone. We all want to make sure the scheme is around in the future.
But – and it is a big but – we also want to make sure that people get the support they need. And don’t have to jump through unnecessary and endless hoops to get it.
Wasn’t this why we all fought for the NDIS in the first place?
Want to read more?
For more about the Federal Budget – So what did the Federal Budget reveal about the NDIS?
For more about the new NDIS assessments – Putting NDIS assessments to the test
Take action on NDIS assessments – Email or talk to your local MP
Join the conversation