
Data, data, data everywhere. But what does it all mean?

So the National Disability Insurance Agency released the latest NDIS Quarterly Report this week. If you have never checked out the Quarterly Report we encourage you to do so – it’s a great way of finding out how the NDIS is tracking and there’s lots of juicy stuff in there.
But at a whopping 495 pages there’s a lot to get through so here’s just a few things that jumped out at us straight away.
Some good things …
✅ There are now more than 360,000 people in the scheme. About 150,000 of those are people who have never received support before. That’s about 40 per cent. That fact doesn’t get a lot of attention. But it should. It tells you why we all fought so hard for the NDIS in the first place. Because there were people out there who desperately needed support and who were Not. Getting. It. Now they are. And that’s a good thing.
✅ The NDIA are working their way through the big backlog of reviews. In December last year there were a whopping 12264 reviews still open. That included change of circumstance reviews and reviews of reviewable decisions (what a mouthful). At the end of March that figure had dropped to 7292. Not quite half way but still a sizeable drop in three months. But that also means that there are still more than 7000 people waiting for an outcome of a review. That’s still a lot of people in limbo.
✅ The NDIA have also been working on the big backlog of kids waiting to get support. About 30 per cent people who came into the scheme in the last three months were kids. And wait times for kids have fallen by more than 50 per cent compared to last year.
✅❌There has been some progress in bringing in people who were really missing out. About seven per cent of people who came into the scheme in the last three months identified as Aboriginal or Torres Strait Islander. More than 11 per cent identified as Culturally or Linguistically Diverse. While there is clearly still a really long way to go at reaching people, at least the figures are heading in the right direction.
✅❌There has been a small – and we mean tiny – drop in both the number of young people with disability admitted to aged care and in the overall number of young people living in aged care. Again much, much more work to be done.
Some interesting things …
It’s interesting that about 30 per cent of all participants self manage all or part of their NDIS plan. While that figure is up from the early years of the scheme, it has stayed steady for a while now.
Self management offers participants and their families the greatest amount of flexibility. You can use registered and unregistered providers and you can pay non NDIS prices. For many people, this means they get greater value out if their plans. And can use the providers they want.
We reckon more people would take this option if the scheme weren’t so damn hard to navigate. And if there was more help for you to do it. And if you could be confident the NDIS would be consistent and not change the rules up half way round on you.
All the shenanigans over iPads and smart devices in the last month just show how difficult it is to do the right thing when the goal posts keep shifting.
For participants who have been in the scheme for three years now, there has been a definite increase in their social and community participation over time. This is true of all age groups.
But unfortunately the same can’t be said for employment. In fact for people aged over 25, things have gone backwards.
For people aged between 15 and 24 years old who have been in the scheme since 2016, the rate of participation in work has doubled (from 12% to 24%). But for those aged 25 years and over, the rate has dropped two points (from 25% to 23%).
While there are many things that affect the rate of employment that are beyond the control of the NDIS (let’s start with ableist and discriminatory attitudes towards disability shall we?) there are things the NDIS could be doing to help. Beyond setting up another taskforce or diverting ILC money.
And some worrying things …
😞 It’s still taking a while to go from being granted access to the scheme to getting your first plan. While access is being decided in days, it is still taking about 100 days for people to get their first plan. This is 31 per cent faster than a year ago, but it is still a really long time if you are waiting for support. And access being decided in just a few days might be a bit of a mixed bag too. Great if the answer is a quick yes – not so great if it is a quick no.
❌ The proportion of plans “activated” within 90 days is at 86 per cent. Activated is just a fancy way of saying “get going”. So let’s just think about that for a moment. That means 14 per cent of participants don’t do anything with their NDIS plan or funding for three whole months.
Unfortunately, that really doesn’t surprise us at all. While there might be good reasons for a small number of people – illness for example might stop you getting things underway – we reckon for most people it is a bad thing. It means they need support but are not getting it. And they aren’t getting it because it’s all too hard to navigate and there is no one to help them. And we would take a guess that most of those people who are not using their plans are the ones who are most in need of help.
And just to be clear – 14 per cent of 360,000 people is about 50,000 people. That’s a lot of people who are not getting any benefit out of the NDIS.
If the NDIS was working the way it should that figure would be much, much smaller.
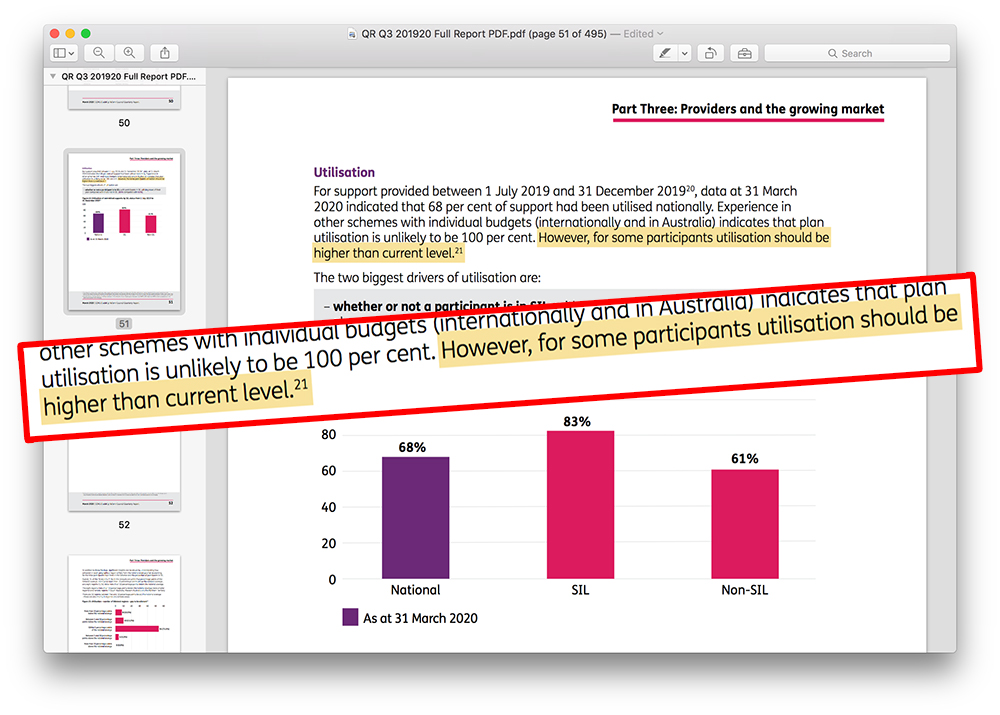
😯 And the winner for the understatement of the year (and perhaps the last seven years) goes to whoever wrote the statement on page 51. Plan utilisation rates are currently sitting at 68 per cent. Plan utilisation is just a fancy way of saying how much of your plan you are using. So on average people are using less than 70 per cent of the funding in their plan. And these figures are inflated by people who are in Supported Independent Living (who tend to use most of their funding). So if you take them out, plan utilisation falls even further to 61 per cent.
That’s clearly not a good thing. But it was summed up in just one line:
“However, for some participants utilisation should be higher than current level.”
Ah yes – yes it should. So let’s see some action on it?
So if you want the summary version…
The NDIA have been cracking on with some of the backlogs that were really hurting people. That’s good. But we are still a fair way from 460,000 people in the scheme. And a better way to clear the backlog of reviews would be not to have so many in the first place …
What the figures tell us is that while we are making some progress in some areas, we are not in others. And that we have to keep the pressure on for work to happen in the areas we think need improvement – things that we think are important, like clear communication and more flexibility. Otherwise time and resources will be diverted into areas that won’t make much difference to us on the ground. Or may even make things worse.
If you want to read more:
You can find this Quarterly Report and all the old Quarterly Reports on the COAG Quarterly Report Page on the NDIS website.
Join the conversation