
| 22 January 2015
cantaffordnottohaveNDIS
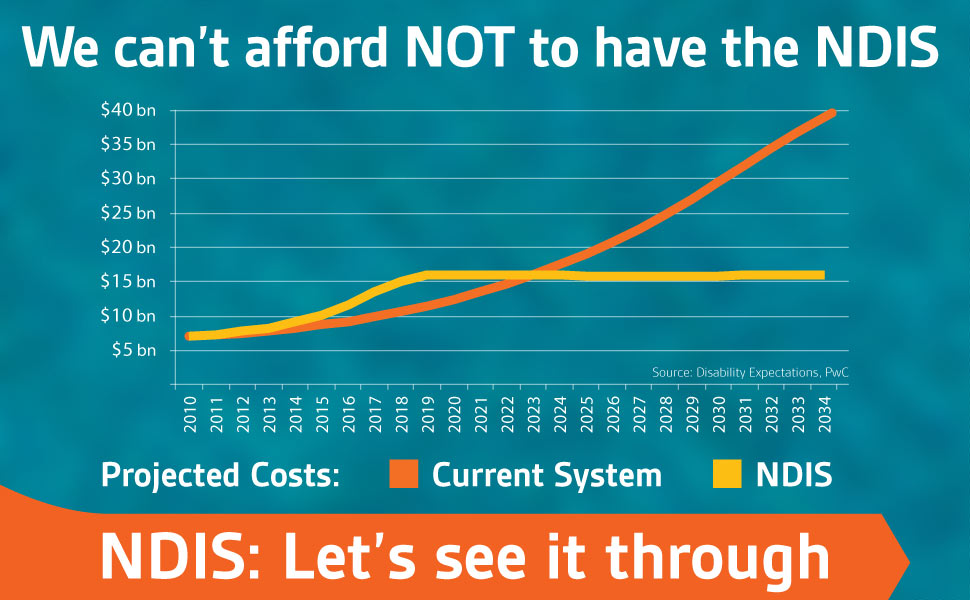
The graphic shows that while there is a short term increase on spending under the NDIS between 2015 and 2019, those costs are projected to level off. Whereas if the old system is retained, costs will continue to escalate.
Join the conversation